


 165 / 180

163
Summary consolidated annual financial statements
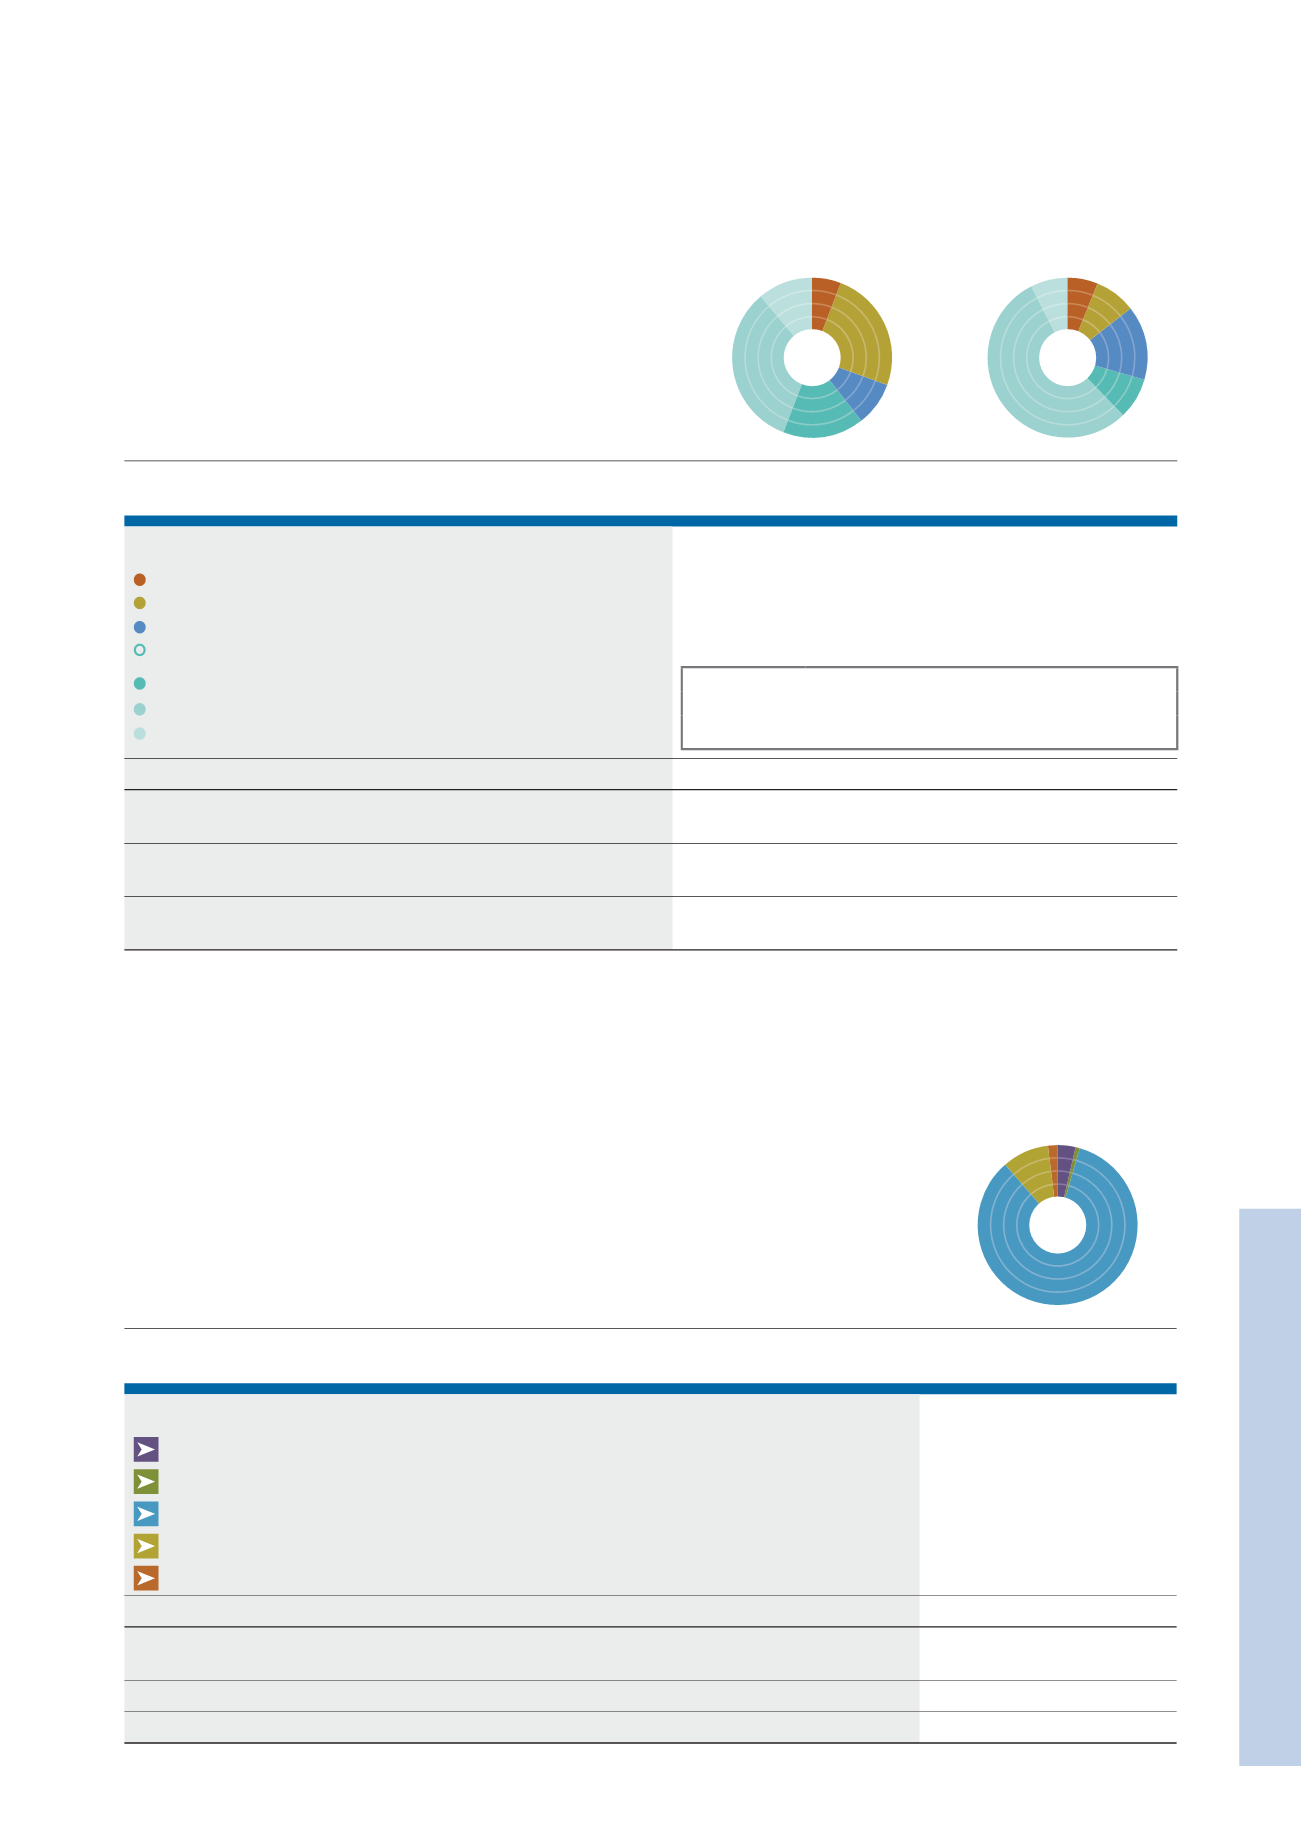
FINANCIAL POSITION: CURRENT ASSETS AND CAPITAL EXPENDITURE
Current assets
Capital expenditure
Note: Graphs represent F2014 values only
(R'000)
2014
2013
Restated*
2014
2013
Restated*
Operational segments
Investments and Concessions
301 051
191 956
16 223
33 334
Engineering & Construction
1 245 626
467 703
21 867
8 640
Manufacturing
444 724
452 377
39 201
64 572
Construction
2 947 417
2 927 094
185 158
240 877
Building and Housing
828 623
808 717
21 978
6 054
Civil Engineering
1 568 433
1 716 557
143 962
166 147
Projects
550 361
401 820
19 218
68 676
4 938 818
4 039 130
262 449
347 423
Joint arrangements equity accounted and joint arrangements wholly
consolidated on adoption of IFRS 11
(35 666)
(45 505)
(856)
(3 951)
4 903 152
3 993 625
261 593
343 472
Bank balances and cash
2 912 240
2 954 123
–
–
Total current assets per statement of financial position
7 815 392
6 947 748
–
–
Property, plant and equipment – additions
–
–
261 593
343 472
The measures of current assets and capital expenditure have been disclosed for each reportable segment as these are regularly
provided to exco.
GEOGRAPHICAL INFORMATION
South Africa is regarded as the group’s country of domicile. As described, the various geographies are monitored via operational hubs
and thus disclosed as such below.
Revenue
Note: Graphs represent F2014 values only
(R'000)
2014
2013
Restated*
Geographical regions
Eastern Europe
581 860
488 493
Eastern Africa
143 781
86 251
Southern Africa
12 945 974
8 580 022
Central Africa
1 447 380
1 389 137
Western Africa
277 374
586 960
15 396 369
11 130 863
Joint arrangements equity accounted and joint arrangements wholly consolidated
on adoption of IFRS 11
(56 739)
(87 716)
15 339 630
11 043 147
Per income statement
15 339 630
11 043 147
* Restated for the adoption of IFRS 11 – Joint Arrangements and IAS 19 (Revised) – Employee Benefits.