


 164 / 180

162
GROUP FIVE
Integrated annual report 2014
Group segmental analysis
continued
The segmental information presented below includes the reconciliation of IFRS measures presented on the face of the income
statement to non-IFRS measures which are used by management to analyse the group’s performance.
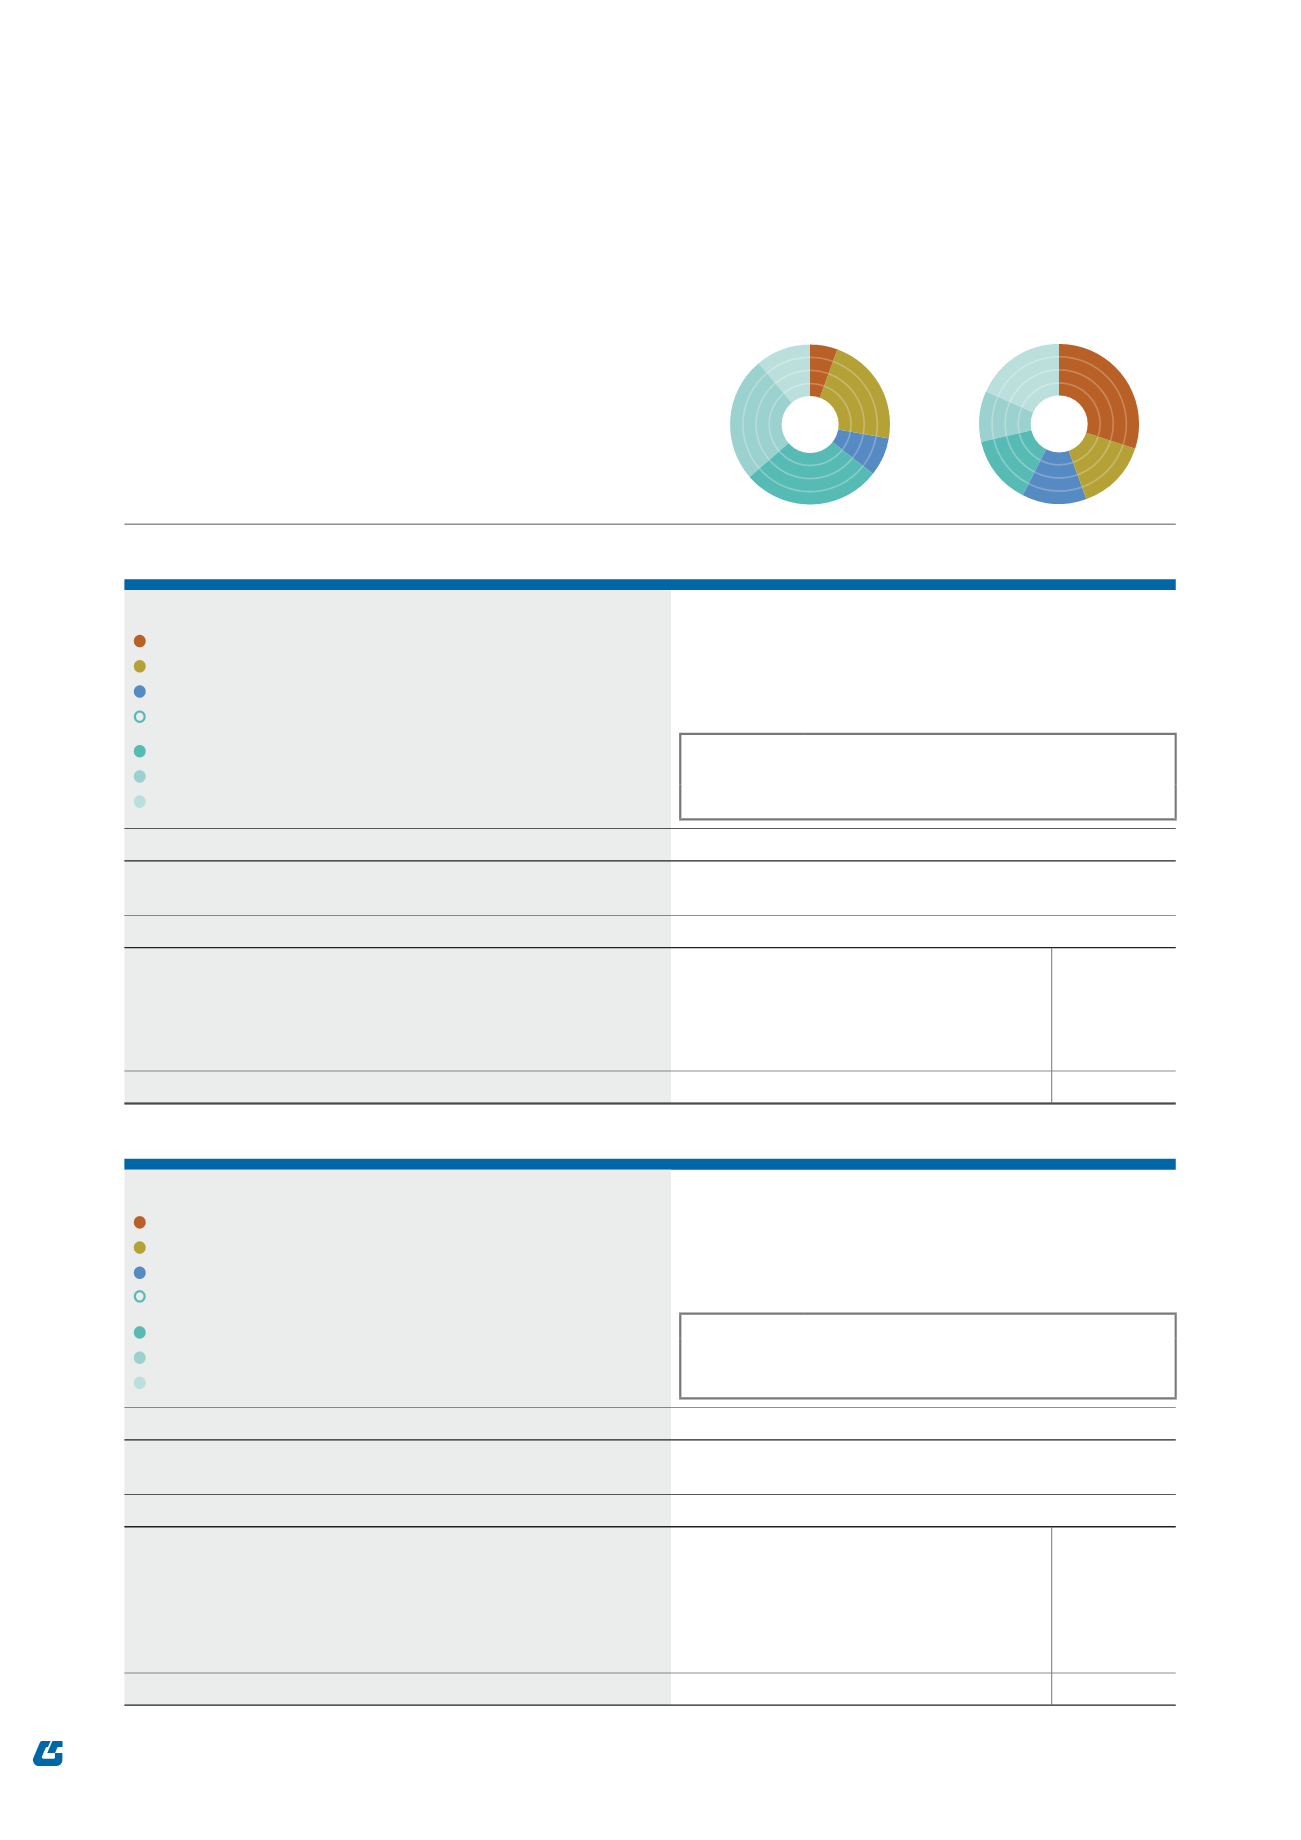
FINANCIAL PERFORMANCE: GROUP REVENUE AND OPERATING PROFIT
Revenue
Operating profit
Note: Graphs represent F2014 values only
2014 (R’000)
Gross
revenue
Internal
revenue
External
revenue
Operating
profit
Operational segments
Investments and Concessions
905 013
–
905 013
197 021
Engineering & Construction
3 520 625
–
3 520 625
93 815
Manufacturing
1 239 449
(200 186)
1 039 263
86 181
Construction
10 247 896
(316 428)
9 931 468
277 045
Building and Housing
4 475 547
(45 034)
4 430 513
90 817
Civil Engineering
4 031 537
(271 394)
3 760 143
66 567
Projects
1 740 812
–
1 740 812
119 661
15 912 983
(516 614)
15 396 369
654 062
Joint arrangements equity accounted and joint arrangements wholly
consolidated on adoption of IFRS 11
(56 739)
(9 138)
15 339 630
644 924
Adjustment for non-operational items
Pension fund valuation surplus
6 944
Loss on impairment of investment in associate and loss on
acquisition of interest in subsidiary – Investments and Concessions
(2 002)
Re-measurement of employment obligation
(3 020)
Operating profit per income statement
646 846
2013 (R’000)
Restated*
Gross
revenue
Internal
revenue
External
revenue
Operating
profit
Operational segments
Investments and Concessions
728 517
–
728 517
174 352
Engineering & Construction
1 174 171
(3 951)
1 170 220
28 521
Manufacturing
1 221 731
(160 474)
1 061 257
83 848
Construction
8 403 763
(232 894)
8 170 869
265 563
Building and Housing
3 331 779
(95 779)
3 236 000
40 332
Civil Engineering
3 354 236
(137 115)
3 217 121
109 287
Projects
1 717 748
–
1 717 748
115 944
11 528 182
(397 319)
11 130 863
552 284
Joint arrangements equity accounted and joint arrangements wholly
consolidated on adoption of IFRS 11
(87 716)
(7 501)
11 043 147
544 783
Adjustment for non-operational items
Pension fund valuation surplus
9 458
Izakhiwo Imfundo Bursary trust: share-based payment expense
(16 813)
Loss on impairment of investment in associate – Investments
and Concessions
(2 069)
Re-measurement of employment obligation
(7 114)
Operating profit per income statement
528 245
Sales between segments are carried out at arm’s length and are reflected above.
* Restated for the adoption of IFRS 11 – Joint Arrangements and IAS 19 (Revised) – Employee Benefits.